topics
CloudHealth has a variety of reports that you can use to gain insight into your historical and future cloud spend, improve your margin, and maintain the health of your cloud environment.
- Using Reports to Ensure Customers Get the Most out of CloudHealth
- Using the Invoice Report
- Using the Cost History Report
- Using the Margin History Report
- Use Policies to be Notified about Specific Events
- Use Perspectives to Gain Insight into Your Environments
- Use Custom Dashboards to View Specific Environment Details
Using Reports to Ensure Customers Get the Most out of CloudHealth
You can create custom reports when setting up new customers or configuring existing customers to ensure that they are getting the most out of the platform. Custom reports are modified reports that allow you to view data in a specific way. You can save and subscribe to custom reports that you use most often.
This section only covers recommended reports. For more information on other types of reports, and help setting up reports, see Reporting.
Cost history by months and accounts – this report shows overall cloud spend by account for AWS, or subscription for Azure. Using this report, you can visualize where costs are rising, and how these increases impact overall cloud spend. For an example of the cost history report, see Using the Cost History Report.
(AWS only) Compute cost before and after reserved instances and savings plans – this report shows how much a customer saves by purchasing reserved instances or savings plans. Using this report, you can compare how much the same usage would have cost without RIs or SPs.
Use Subscriptions to Share Data Analyses and Reports
Subscriptions can help you share your findings from reports quickly with customers or individuals within your organization. You can subscribe to any standard or custom report, and schedule automatic report delivery to the appropriate people.
This section only covers recommended subscriptions. For help with subscribing to reports, see Actions and Subscriptions.
Cost summary pulse report – this report summarizes projected cost compared to actual cost, breaking down each cost by category. You can also categorize this report by perspectives. You can use this report to stay up to date with your month to date cloud spend.
Health check pulse report – this report highlights cost savings, cloud governance points, and areas of potential security risks. The health check pulse report is a high-level report that spans all assets across all perspectives. You can also categorize this report by perspectives or other useful views. You can use this report to identify potential monthly savings, monitor infrastructure changes, and mitigate potential security risks.
Security report – this report provides best practices from AWS or Azure, and displays them in a single dashboard. You can use this report to stay on top of any potential issues or risks within your cloud environment.
(AWS only) Savings plan dashboard – this is a default dashboard that is tailored to Savings Plan coverage and savings. If you have customers that use Savings Plans, this report can help you keep on top of monthly or weekly Savings Plan performance.
Using the Invoice Report
Insights This Report Provides
- Are all my customers' invoices present in the report?
- If an invoice is missing from the report, was that invoice configured correctly in CloudHealth and was the payer account ID entered correctly?
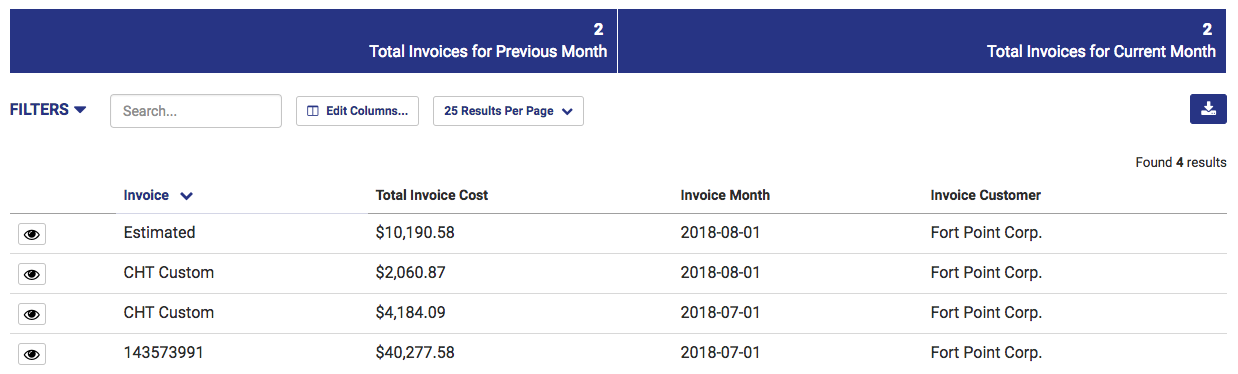
The Invoice Report is primarily used for accounting reconciliation.
Default Columns
- Invoice: The name of the invoice
- Total Invoice Cost: The total cost billed in the invoice for the specified month
- Invoice Month: The month for which the invoice was generated
- Invoice Customer: The customer the invoice was billed to
Using the Cost History Report
Insights This Report Provides
- What is the spending trend per customer?
- How much is each customer billed?
- What services are customers consuming?
- How are consumption trends changing across the customer base?
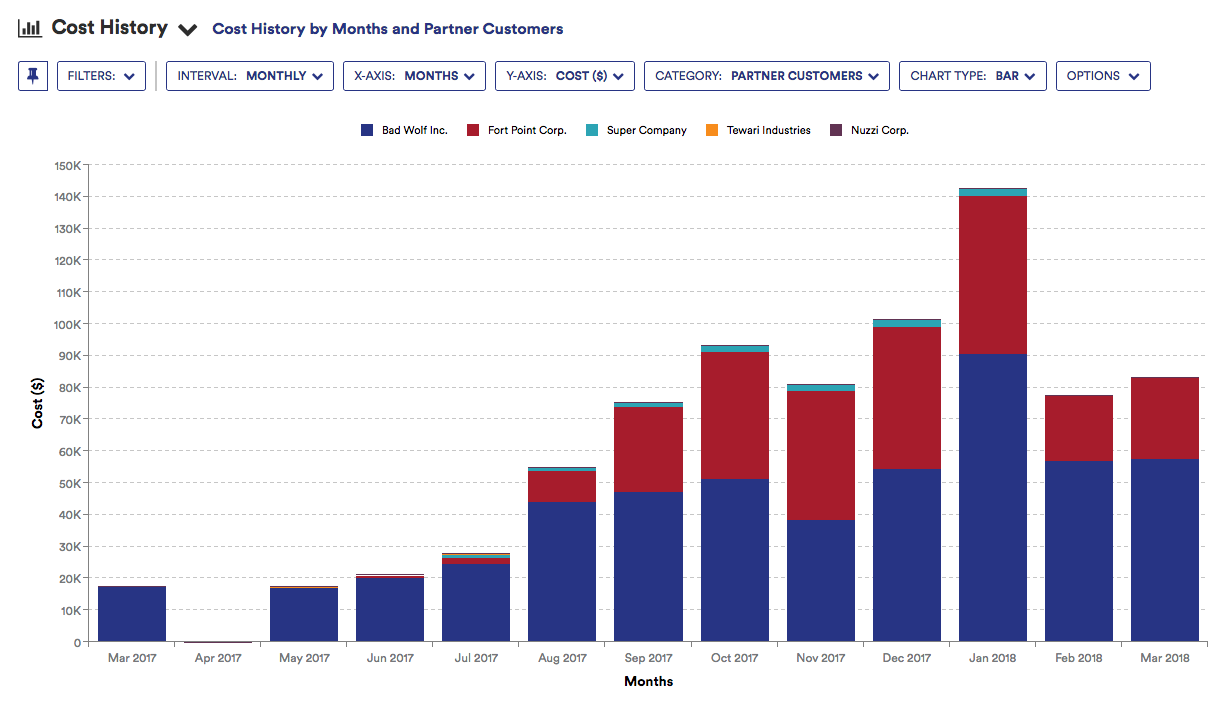
Report Default Settings
- Interval: Monthly
- X-Axis: Months
- Y-Axis: Cost ($)
- Category: Partner Customers
- Chart Type: Bar
Example
Cost History by Months and Partner Customers (Default View)
Variations: In the Y-Axis dropdown, select both of the following cost types to compare the customers' billed cost (how much you charge the customers) to the partner's billed cost (how much you pay AWS):
- Cost ($): The cost of AWS services that the customer consumes, either through a partner's consolidated bill or through the customer's own consolidated bill. Cost ($) is inclusive of all AWS services billed at the AWS list price, as well as any additional line items or updates to pricing line items.
- Partner Cost ($): The cost of the AWS services that the partner uses through a partner's consolidated bill. The Partner Cost ($) represents a partner's cost of goods sold. This cost is described as the amount payable to AWS in the Detailed Billing Record (DBR). Note that this total may differ from the final invoice amount AWS provides to the partner based on adjustments made by AWS that are not reflected in the DBR.
Using the Margin History Report
Insights This Report Provides
- What are your partner profit margins (the difference between the partner's billed cost and the customer's billed cost) per customer?
- How are reseller margins shifting over time as customer consumption patterns shift?
- How are value-add services contributing to the margin?
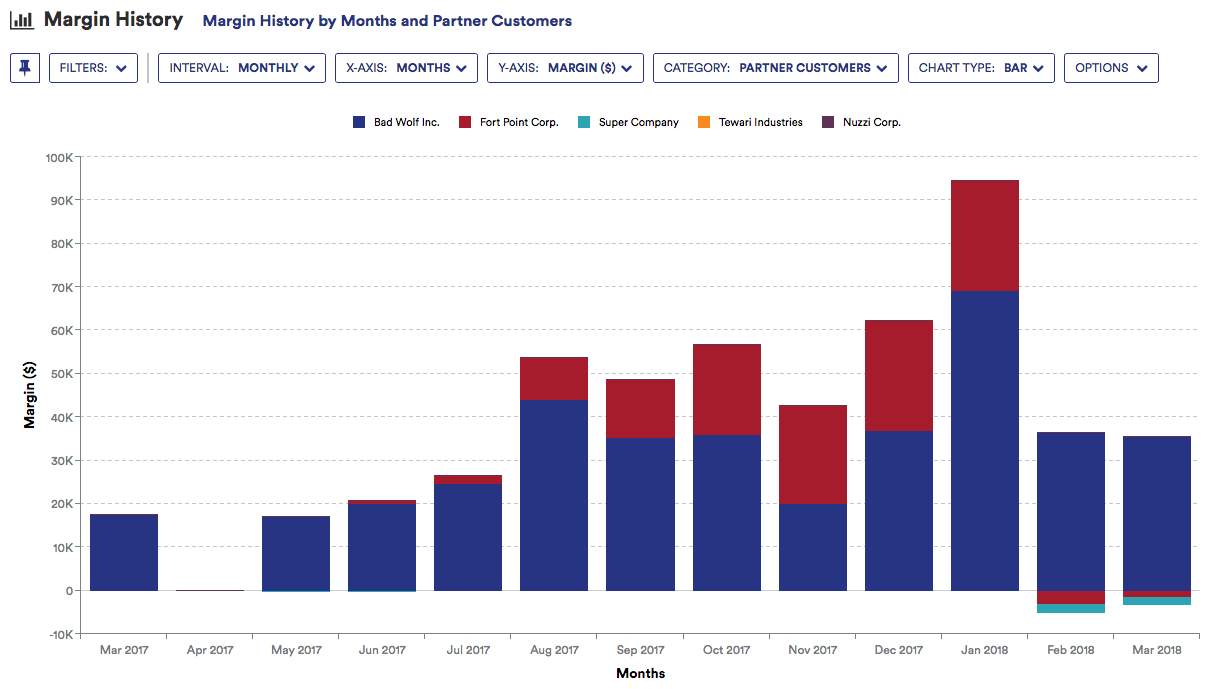
The Margin ($) in the Y-Axis represents the difference of the Cost ($), or the customer billed amount, and the Partner Cost ($), or the partner billed amount. Refer to the Cost History Partner Customer Report for more information on Cost ($) and Partner Cost ($).
Report Default Settings
- Interval: Monthly
- X-Axis: Months
- Y-Axis: Margin ($)
- Category: Partner Customers
- Chart Type: Bar
Example
Margin History by Months and Partner Customers (Default View)
Use Policies to be Notified about Specific Events
Policies are sets of rules that help you govern aspects of your cloud infrastructure, such as cost, availability, security, performance, and usage. Using policies can help you focus on the key aspects of your cloud infrastructure that require attention. You can specify a desired operational state and create policies to monitor for conditions that deviate from that state. When conditions change, policies can even take actions such as notify you about the change, or, in some cases remediate the condition.
This section only covers recommended policies that can help you better manage your customers. For more information on other types of policies, and to get help creating policies, visit Policies.
Account Configuration Status - this policy sends a notification when accounts, enrollments, service principals, or projects change status from Healthy to Warning or Critical. Accounts that are in a Critical state usually mean that cloud cost and usage data are no longer being collected. Accounts in a Warning state may not be collecting asset metadata. The policy that alerts on this status change helps you quickly identify and remediate the error relating to that account.
Expiring Reservations - this policy sends a notification when Azure or AWS Reservations are about to expire. Because Reserved Instances provide significant discounts on services such as Virtual Machines, EC2 and RDS instances usage, expired reservations can lead to increases in cloud spend.
Total Daily Cost Increase - this policy sends a notification if there are sudden, significant increases in Cloud Spend.
Missing tags - this policy sends a notification about any assets that are missing certain tags, or missing all tags. Tags are helpful in classifying and organizing a customer’s environment, and can also be used within Perspectives to view cloud assets by group.
Budget vs Actual Monitoring - this policy sends a notification if projected cloud spend exceeds a defined budget.
Use Perspectives to Gain Insight into Your Environments
CloudHealth Perspectives are "lenses" through which you want to view your infrastructure. They provide a framework for categorizing all the assets within your infrastructure. Sample perspectives might include Environment, Application, Department, Function, Project, or Cost Center.
For more information and help creating Perspectives, see Perspective Management.
Use Custom Dashboards to View Specific Environment Details
Dashboards provide you and your customers a high level view into the environment. You can customize dashboards to suit specific needs or requirements, such as for a multi-cloud environment. You can also set a custom dashboard as the default when you log in to the platform.
This section only covers recommended dashboards that can help you better manage your environment. For help on creating custom dashboards, visit Custom Dashboards.
Multi-cloud dashboard – you can create a multi-cloud dashboard to provide a quick overview of all your cloud environments.